Hello everyone,
In today’s blogpost I will walk you through the process of creating an admin audit log dashboard for Defender Advanced Threat Protection. During my past customer engagements, I was often asked if there is a way to show device actions taken by Defender ATP admins. The answer is yes, this is possible. First the information is available through the Defender ATP API, second the information is also stored within the Windows event log of the device itself.
Defender ATP API
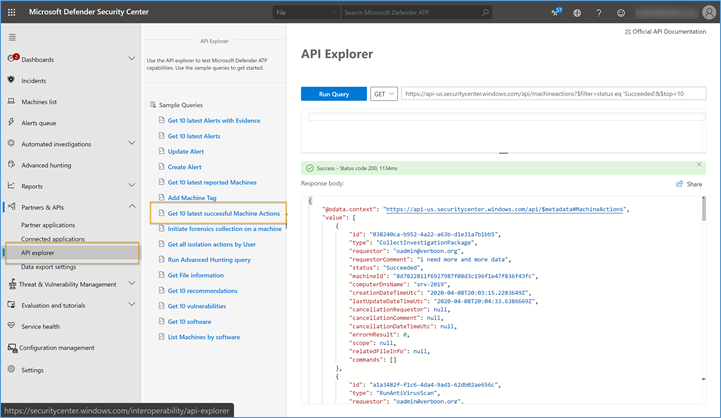
Microsoft Defender ATP exposes much of its data and actions through a set of programmatic APIs. Through this API we can also retrieve a list of Machineactions. Within the Microsoft Defender Security Center we can access the API through the API explorer.
Windows Device Event log
On a Defender ATP managed device, we can also find machine action logs within the Microsoft-Windows-SENSE event log. Event ID****Description59Starting command:60Failed to run command:71Succeeded to run command: I have written about this in an earlier blog post, Microsoft Defender Advanced Threat Protection – Respond Actions Events.
API, Event logs? Management wants a dashboard!
While accessing an API or event log data should be an easy task for the average engineer, you probably don’t want to run that task every time when someone needs that information, and with someone I refer to your colleagues in the organization that aren’t familiar with accessing an API. What we need is a dashboard that is easily accessible and provides us with the information we want instantly.
The MDATP Admin Audit Log Dashboard
Use the following step-by-step instructions to create your MDATP Admin Audit Log dashboard.
Prerequisites
To create the MDATP Admin Audit Log we use the following:
- Microsoft Defender ATP API
- Azure Logic App
- Azure Log Analytics
Preparing the Azure Log Analytics Workspace
We are going to store our Defender ATP machine action logs into an Azure Log Analytics workspace, so let’s create one.
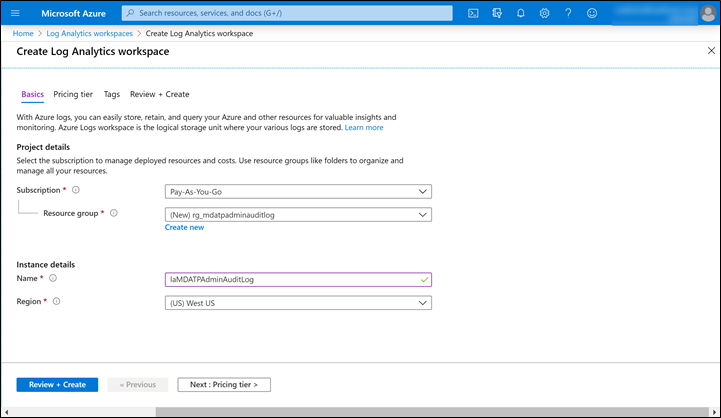
#Description1Logon to the Azure Portal and go to Log Analytics workspaces
 2Select **Add **for creating a new Log Analytics workspace
- Select the Subscription, then create new Resource Group rg_MDATPAdminAuditLog (or use an existing one)
- Enter a name for the log analytics workspace, in this example I called it laMDATPAdminAuditLog
- Select the region where you want to deploy the resources, in this example West US
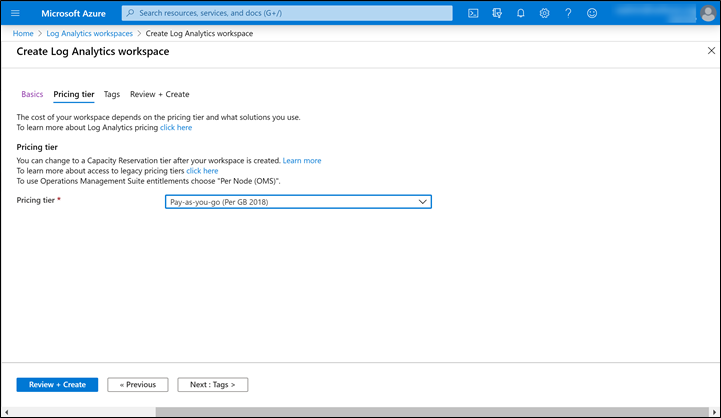
Click on Next: Pricing Tier ****3Select your preferred Pricing Tier for Azure Log Analytics
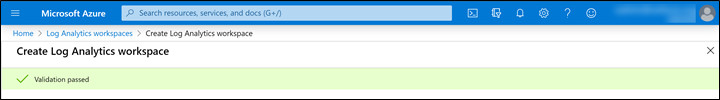
Unless you want to set tags on your resource, click on Review + Create ****4If all goes well, validation should pass and you can continue creating the Azure Log Analytics workspace
Click on Create
 5Wait until the deployment is complete.
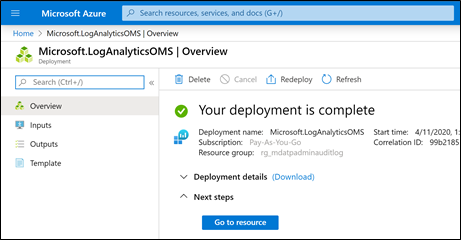
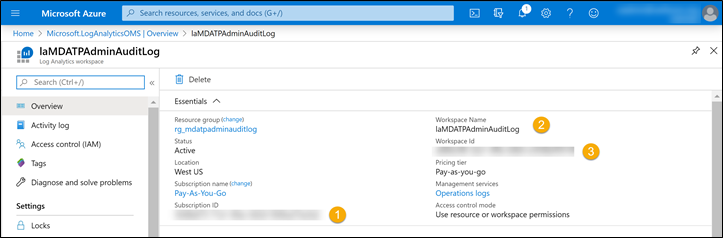
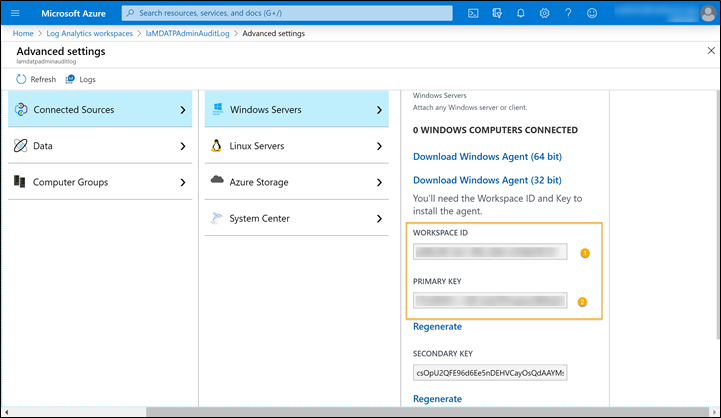
Click on Go to resource****6Take a note of the following information, we will need this later
- **Subscription ID **
- **Workspace Name **
- **Workspace ID
**
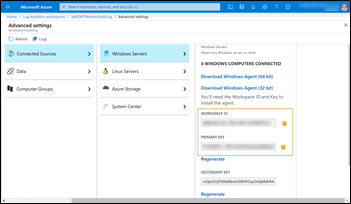
 7Select Advanced Settings
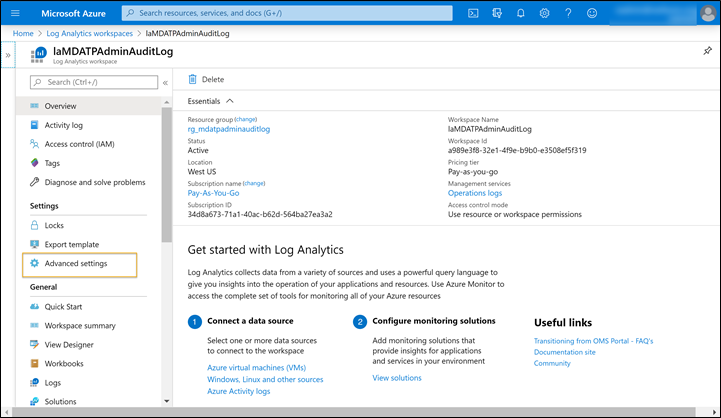
Note down the following information:
- **Workspace ID **
- **Primary Key
**
Preparing the Logic App workflow
We will use an Azure Logic App workflow to retrieve the Machineactions data from Microsoft Defender ATP and store the data into our Azure Log Analytics workspace.
#Description1Logon to the Azure Portal and go to Logic Apps
 2Select **Add **for creating a new Logic App
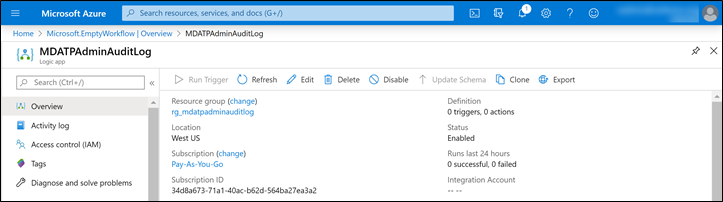
- Select the Subscription, then select the Resource Group rg_MDATPAdminAuditLog we created previously
- Enter a name for the Logic App, in this example I called it MDATPAdminAuditLog
- Select the region where you want to deploy the resources, in this example West US
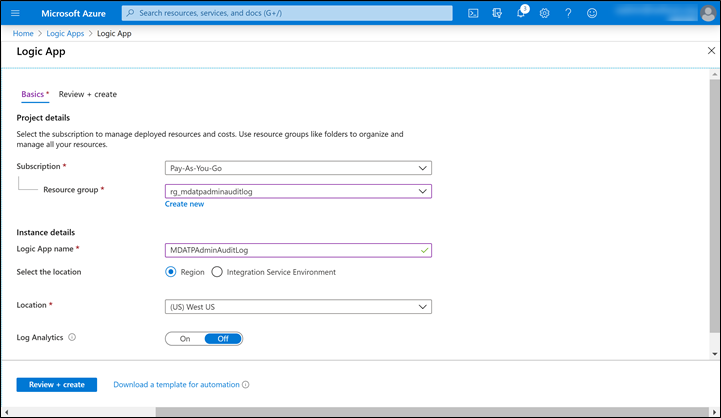
Click **Review + Create **
Click Create
 3Wait until the deployment is complete.
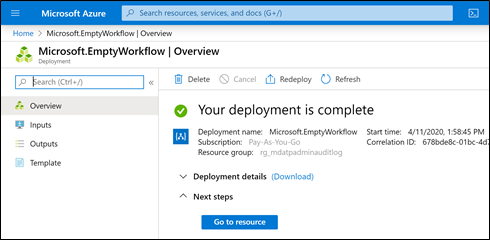
Click on Go to resource****4Click on Edit
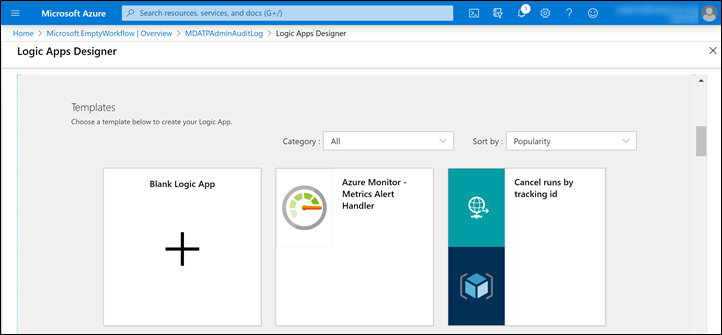
 5Select Blank Logic App
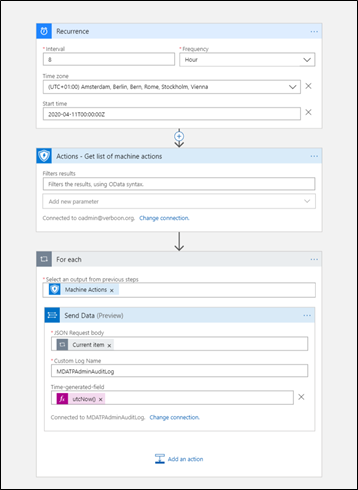
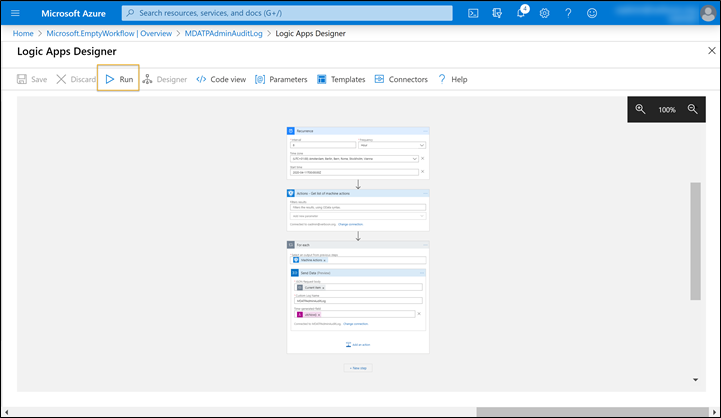
 6We want to run this workflow 3 times per day, therefore our trigger is a schedule.
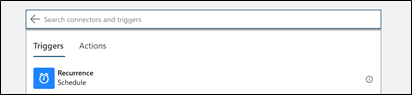
Search for Schedule
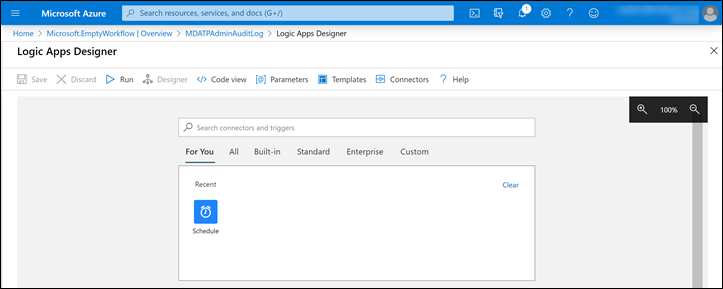
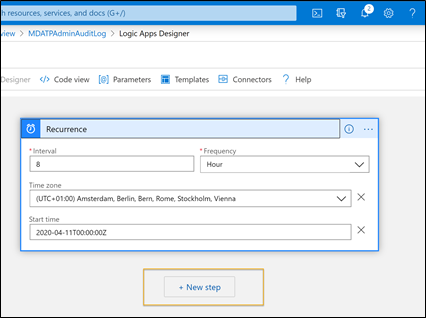
Select Recurrence
Enter the interval: 8, select the frequency: Hour
Then select the Time zone and enter the start time
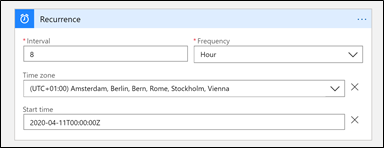
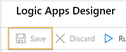
Now is a good time to save our work before we continue
 7Select Next Step
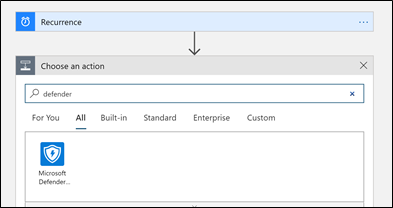
 8We want data from Microsoft Defender ATP, search for **Defender **, when found select Microsoft Defender ATP
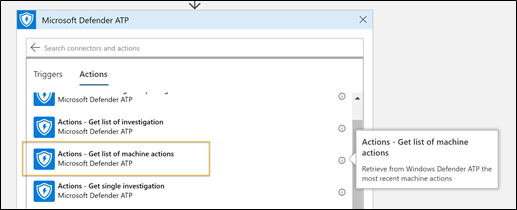
 9From the list of Actions, select Actions – Get list of machine actions
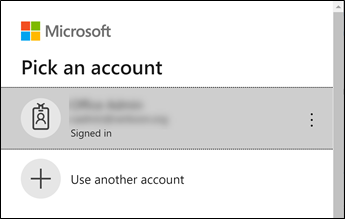
 10We now need to sign into Defender ATP, click on the Sign in button

Select the account to sign-in, or select use another account
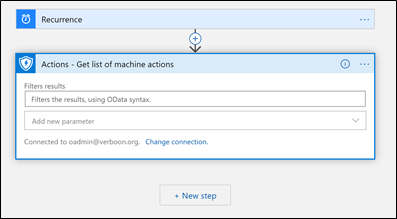
 11We leave the Filter results and parameters empty. Select Next Step
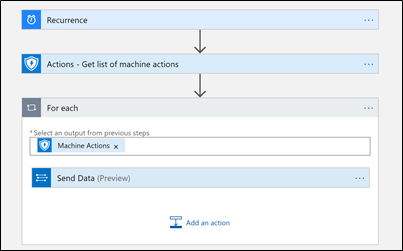
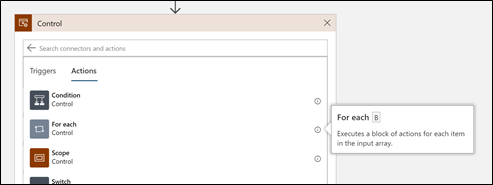
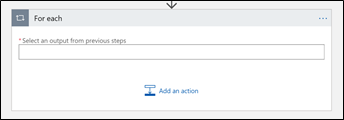
 12Search for **Control, **then select For each
Select an output, click into the ‘Select an output from previous steps’ field
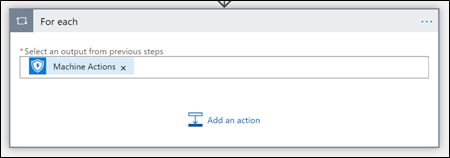
Select Machine Actions
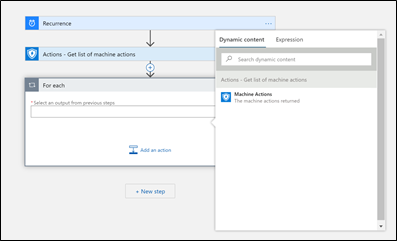
The Machine actions output is added. When you hover over the Machine Actions you should see the following formula:
@body(‘Actions_-_Get_list_of_machine_actions’)?[‘value’]
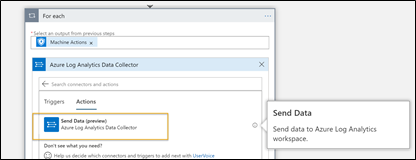
Select Add an Action****13Search for Log Analytics data collector
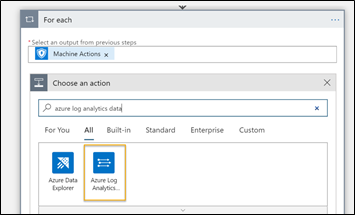 14From the list of Actions, select Send Data (preview)
 15Remember that when we created the Azure Log Analytics workspace, we noted down some information
Provide a name for the connection, MDATPAdminAuditLog
Enter the Workspace ID and **Workspace Key **of the Log Analytics workspace
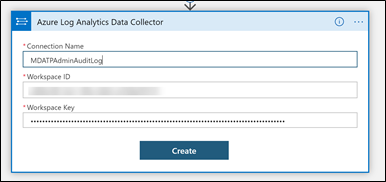
Click Create****16Click into the JSON Request body field, then select Current Item
Enter the name of the Custom log, MDATPAdminAuditLog
Note: This is the name of the custom log that will be created in our Log Analytics workspace
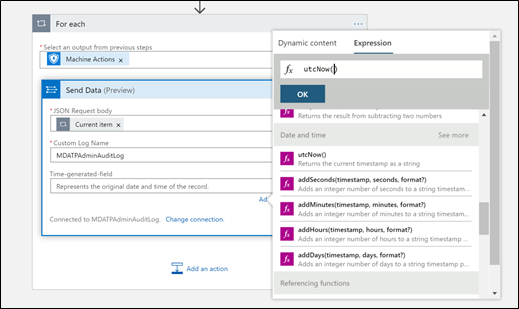
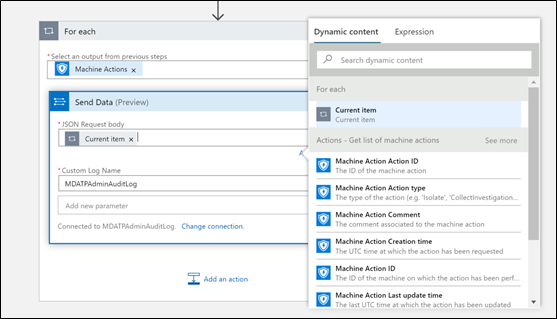 17Select Add parameter and tick the checkbox for Time-generated field
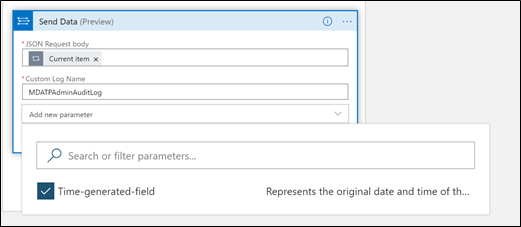
Select **utcNow() **,then click OK
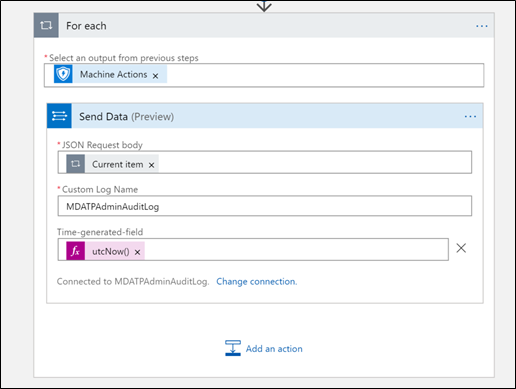 18Our workflow is now complete, now is a good time to save our work again.
 19Next we are going to run our workflow for the very first time, we manually trigger this by clicking on the Run button.
Keep fingers crossed and wait for the process to complete, if all goes well we have a greenOK indicator displayed for each action.
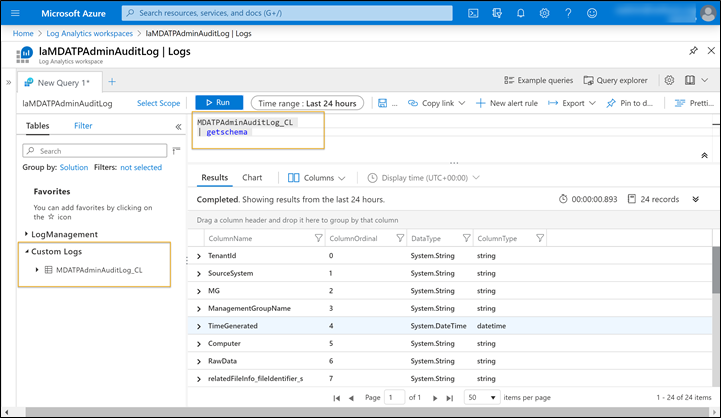
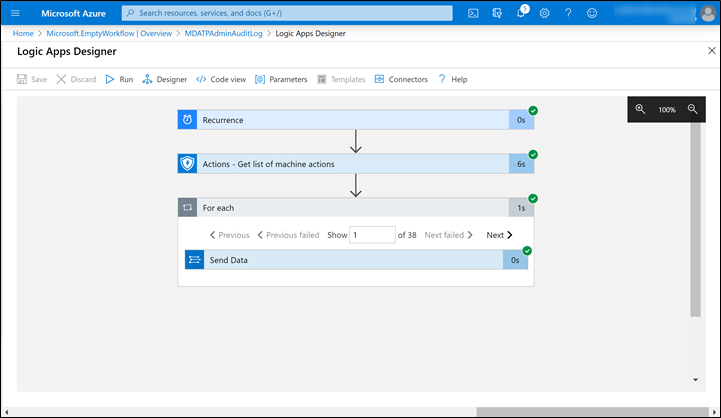 20Our logic app indicates that all actions processed successfully, so let’s head over to our Azure Log Analytics workspace and see the results.
Under the Custom Logs node we should see our newly created custom table MDATPAdminAuditLogs_CL. Note that _CL is automatically added by Log Analytics when ingesting custom data.
Let’s take a look at the schema by running the following query: MDATPAdminAuditLog_CL
| getschema
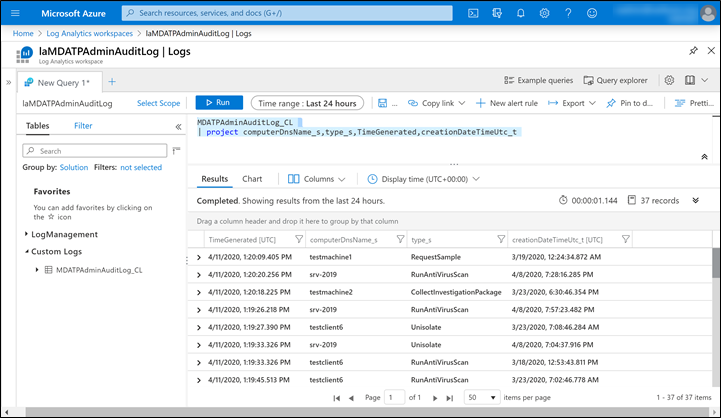
 21Next, let’s take a look at the data ingested by running the following query:
MDATPAdminAuditLog_CL
| project computerDnsName_s,type_s,TimeGenerated,creationDateTimeUtc_t
Note: If you don’t get any data, wait for a couple minutes, as per my experience it can take up to 15 minutes until the data becomes available within Log Analytics
Creating the MDATP Admin Audit Log Dashboard
Great now that we have the Defender ATP machine actions data stored in an Azure Log Analytics workspace, we can continue creating our dashboard. But wait, let’s first prepare the queries for the data we want to include into the dashboard.
The Log Analytics Queries
For our very first dashboard I want to get the following data from our Defender ATP admin audit log:
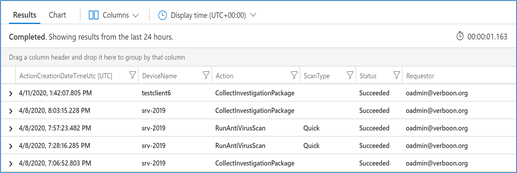
- List of all Machine Actions – displays all the information for each machine action
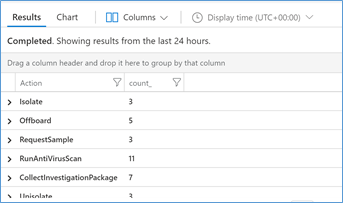
- A summary count of machine actions – displays the total number of triggered actions by Action type
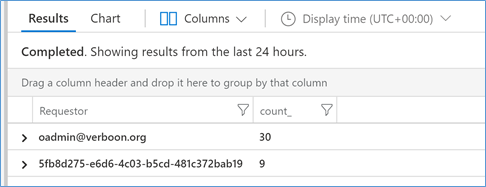
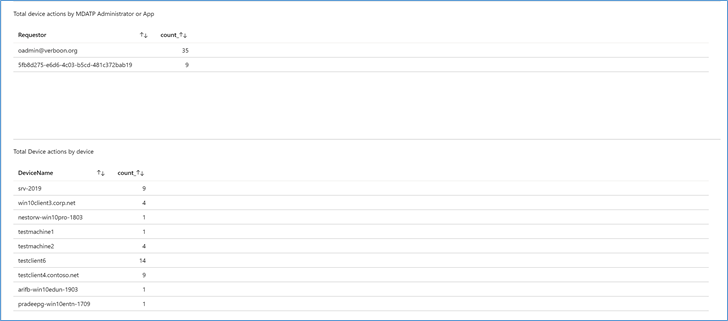
- A summary of action requestors – displays the total number of actions triggered by an MDATP admin or registered App that has permissions to trigger an action.
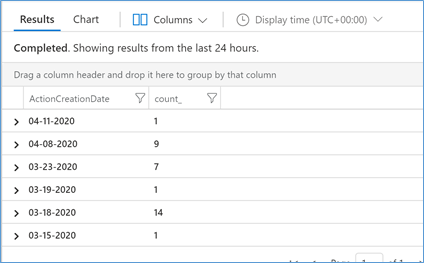
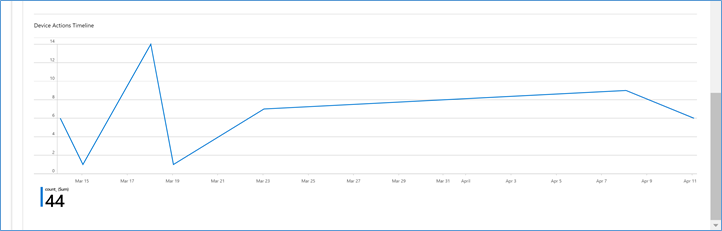
- A summary count by Date – displays the total number of actions by date
**List all Machine Actions****MDATPAdminAuditLog_CL **
**| where TimeGenerated > ago(360d) **
**| extend Action = type_s **
**| extend DeviceName = computerDnsName_s **
**| extend ScanType = scope_s **
**| extend Requestor = strcat(requestor_s, requestor_g) **
**| extend Status = status_s **
**| extend ActionComment = requestorComment_s **
**| extend ActionCreationDateTimeUtc = creationDateTimeUtc_t **
**| extend ActionID = id_g **
**| summarize arg_max(ActionCreationDateTimeUtc, ActionID) by ActionCreationDateTimeUtc,DeviceName, Action, ScanType, Status, Requestor, ActionComment , ActionID **
**| sortby ActionCreationDateTimeUtc desc **
 **Machine Actions SummaryMDATPAdminAuditLog_CL **
**| where TimeGenerated > ago(360d) **
**| extend Action = type_s **
**| extend DeviceName = computerDnsName_s **
**| extend ScanType = scope_s **
**| extend Requestor = strcat(requestor_s, requestor_g) **
**| extend Status = status_s **
**| extend ActionComment = requestorComment_s **
**| extend ActionCreationDateTimeUtc = creationDateTimeUtc_t **
**| extend ActionID = id_g **
**| summarize arg_max(ActionCreationDateTimeUtc, ActionID) by ActionCreationDateTimeUtc,DeviceName, Action, ScanType, Status, Requestor, ActionComment , ActionID **
**| summarizecount() by Action **
 **Machine Actions Requestor SummaryMDATPAdminAuditLog_CL **
**| where TimeGenerated > ago(360d) **
**| extend Action = type_s **
**| extend DeviceName = computerDnsName_s **
**| extend ScanType = scope_s **
**| extend Requestor = strcat(requestor_s, requestor_g) **
**| extend Status = status_s **
**| extend ActionComment = requestorComment_s **
**| extend ActionCreationDateTimeUtc = creationDateTimeUtc_t **
**| extend ActionID = id_g **
**| summarize arg_max(ActionCreationDateTimeUtc, ActionID) by ActionCreationDateTimeUtc,DeviceName, Action, ScanType, Status, Requestor, ActionComment , ActionID **
**| summarizecount() by Requestor **
 Machine Actions By DateMDATPAdminAuditLog_CL
**| where TimeGenerated > ago(360d) **
| extendAction = type_s
| extendDeviceName = computerDnsName_s
| extendScanType = scope_s
**| extendRequestor = strcat(requestor_s, requestor_g) **
| extendStatus = status_s
| extendActionComment = requestorComment_s
| extendActionCreationDateTimeUtc = creationDateTimeUtc_t
**| extendActionCreationDate = format_datetime(ActionCreationDateTimeUtc, ‘MM-dd-yyyy’) **
| extendActionID = id_g
| summarizearg_max(ActionCreationDateTimeUtc, ActionID) byActionCreationDate ,DeviceName, Action, ScanType, Status, Requestor, ActionComment , ActionID
**| summarizecount() bybin( ActionCreationDateTimeUtc,1d) **
 ****
****
Creating the workbook
Now that we have our queries prepared, let’s move on to the final task and create our MDATP Admin Audit log dashboard.
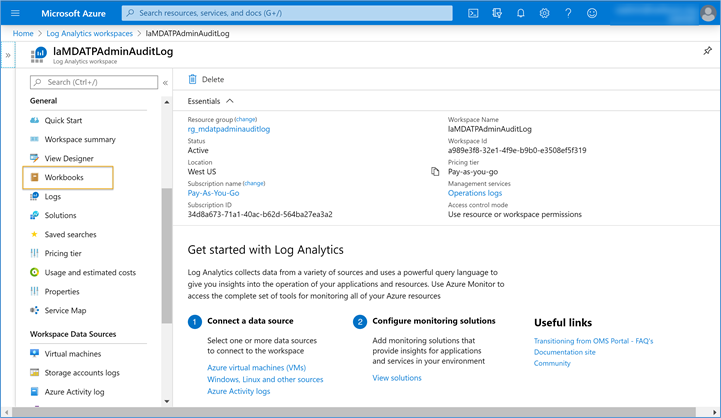
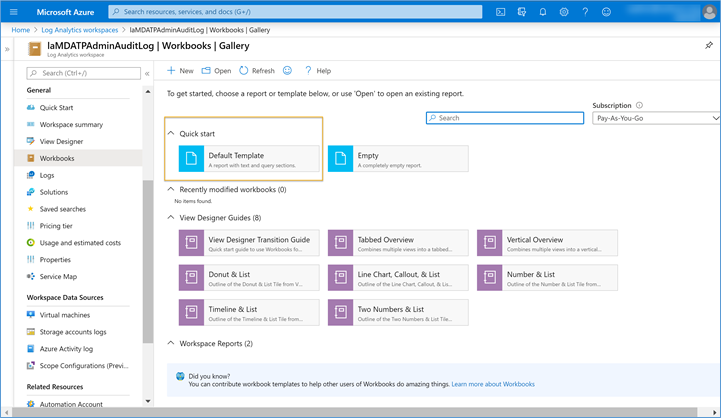
#Description1Within the MDATPAdminAuditLog Log Analytics workspace, select Workbook
 2Select Default Template
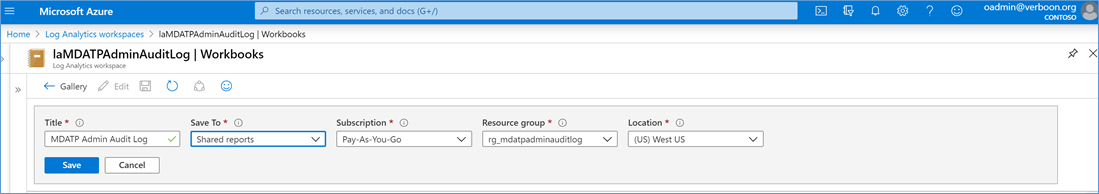
 3Click on the Save Icon and enter the Title for the Workbook, then select Save to **Shared Reports, **then click Save.
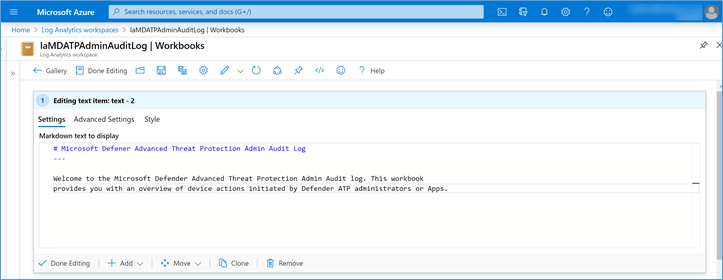
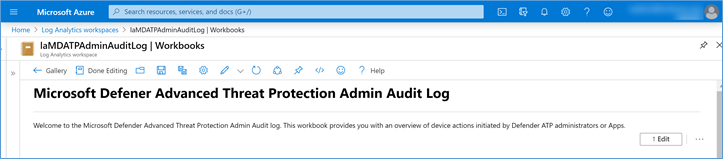
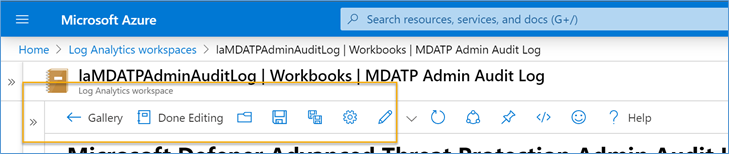
Now that we have saved our workbook, we can continue editing it. First, we are going to adjust the Workbook Title and description, select Edit
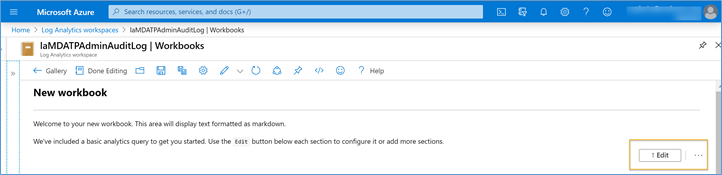
Change the title and a description, then click on Done Editing
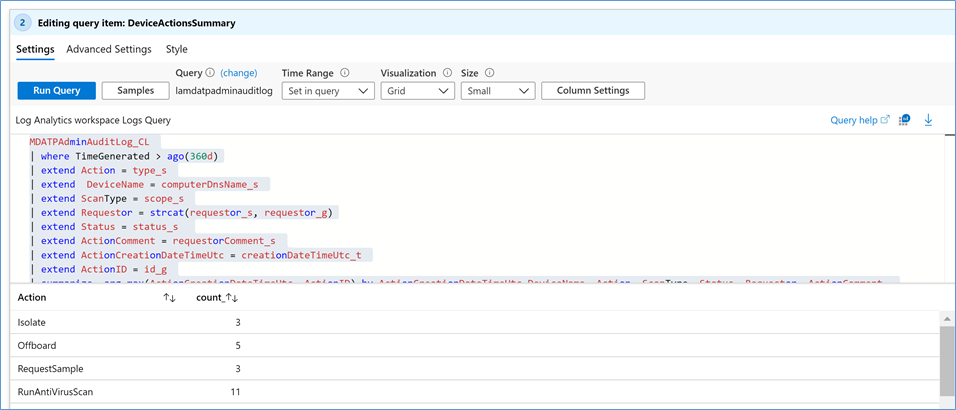
 4Next, we are going to display the total number of actions triggered within the last 360 days. Copy the following query into the query field and then select **Run Query
**MDATPAdminAuditLog_CL
4Next, we are going to display the total number of actions triggered within the last 360 days. Copy the following query into the query field and then select **Run Query
**MDATPAdminAuditLog_CL
| where TimeGenerated > ago(360d)
| extendAction = type_s
| extendDeviceName = computerDnsName_s
| extendScanType = scope_s
| extendRequestor = strcat(requestor_s, requestor_g)
| extendStatus = status_s
| extendActionComment = requestorComment_s
| extendActionCreationDateTimeUtc = creationDateTimeUtc_t
| extendActionID = id_g
| summarizearg_max(ActionCreationDateTimeUtc, ActionID) byActionCreationDateTimeUtc,DeviceName, Action, ScanType, Status, Requestor, ActionComment , ActionID
| summarizecount() byAction
 5From the Visualization drop down menu select Tiles
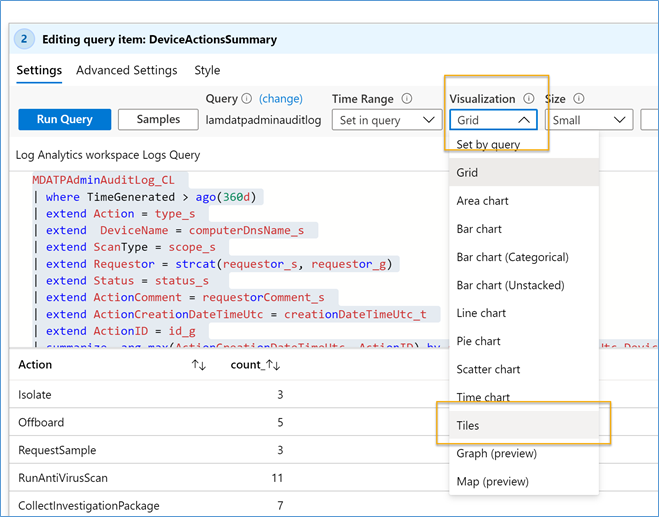
Our dashboard is slowly taking shape.
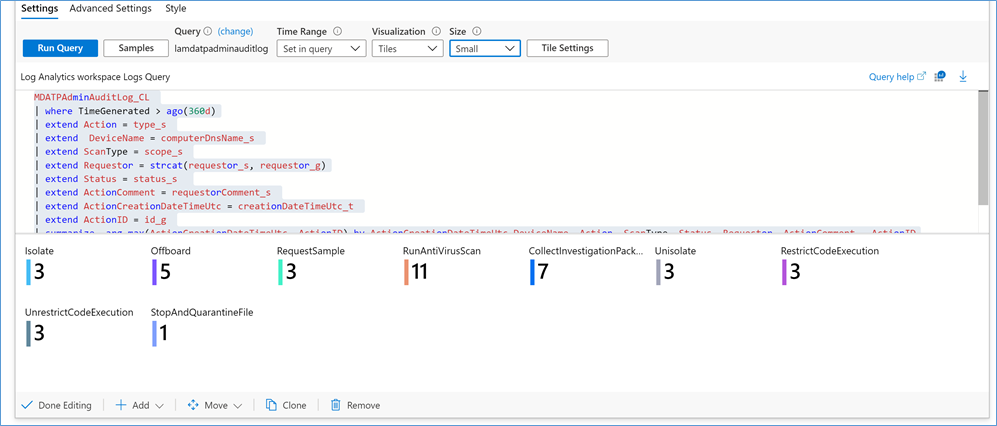
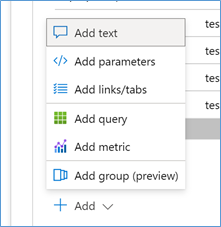
Select Done Editing****6Select Add Query
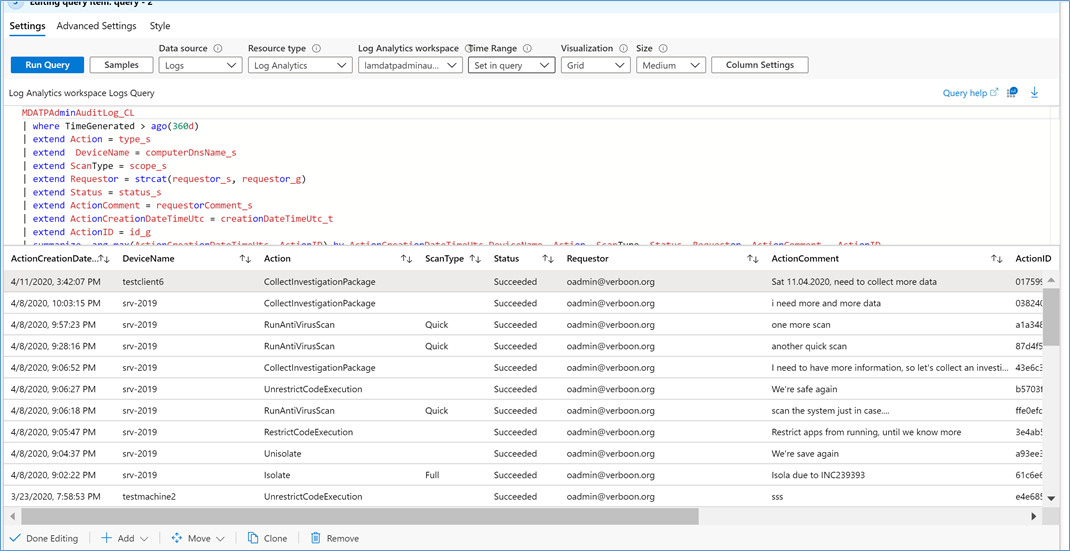
 7Cop the following query into the query field and set the visualization to **Grid, **then select Run QueryMDATPAdminAuditLog_CL
| where TimeGenerated > ago(360d)
| extendAction = type_s
| extendDeviceName = computerDnsName_s
| extendScanType = scope_s
| extendRequestor = strcat(requestor_s, requestor_g)
| extendStatus = status_s
| extendActionComment = requestorComment_s
| extendActionCreationDateTimeUtc = creationDateTimeUtc_t
| extendActionID = id_g
| summarizearg_max(ActionCreationDateTimeUtc, ActionID) byActionCreationDateTimeUtc,DeviceName, Action, ScanType, Status, Requestor, ActionComment , ActionID
| sortbyActionCreationDateTimeUtcdesc
Select Done Editing****8Let’s add a line between this and the next data section, select Add Text
Type — and then click Done Editing
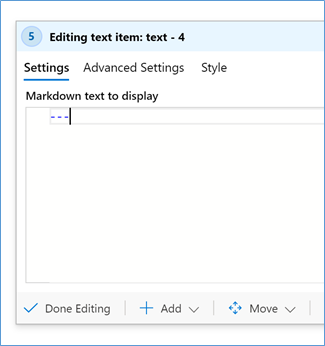
— ? Yes this is the markup language format that draws a line.9Select **Add Query **
Cop the following query into the query field and set the visualization to **Grid, **then select Run QueryMDATPAdminAuditLog_CL
| where TimeGenerated > ago(360d)
| extendAction = type_s
| extendDeviceName = computerDnsName_s
| extendScanType = scope_s
| extendRequestor = strcat(requestor_s, requestor_g)
| extendStatus = status_s
| extendActionComment = requestorComment_s
| extendActionCreationDateTimeUtc = creationDateTimeUtc_t
| extendActionID = id_g
| summarizearg_max(ActionCreationDateTimeUtc, ActionID) byActionCreationDateTimeUtc,DeviceName, Action, ScanType, Status, Requestor, ActionComment , ActionID
| summarizecount() byRequestor
Select Done Editing****10Add a line, as shown in step 811Select **Add Query **
Cop the following query into the query field and set the visualization to **Grid, **then select Run QueryMDATPAdminAuditLog_CL
| where TimeGenerated > ago(360d)
| extendAction = type_s
| extendDeviceName = computerDnsName_s
| extendScanType = scope_s
| extendRequestor = strcat(requestor_s, requestor_g)
| extendStatus = status_s
| extendActionComment = requestorComment_s
| extendActionCreationDateTimeUtc = creationDateTimeUtc_t
| extendActionID = id_g
| summarizearg_max(ActionCreationDateTimeUtc, ActionID) byActionCreationDateTimeUtc,DeviceName, Action, ScanType, Status, Requestor, ActionComment , ActionID
| summarizecount() byDeviceName
Select Done Editing****12Select **Add Query **
Cop the following query into the query field and set the visualization to **Grid, **then select Run QueryMDATPAdminAuditLog_CL
| where TimeGenerated > ago(360d)
| extendAction = type_s
| extendDeviceName = computerDnsName_s
| extendScanType = scope_s
| extendRequestor = strcat(requestor_s, requestor_g)
| extendStatus = status_s
| extendActionComment = requestorComment_s
| extendActionCreationDateTimeUtc = creationDateTimeUtc_t
| extendActionCreationDate = format_datetime(ActionCreationDateTimeUtc, ‘MM-dd-yyyy’)
| extendActionID = id_g
| summarizearg_max(ActionCreationDateTimeUtc, ActionID) byActionCreationDate ,DeviceName, Action, ScanType, Status, Requestor, ActionComment , ActionID
| summarizecount() bybin( ActionCreationDateTimeUtc,1d)
Set the Visualization to Time Chart
Select Done Editing****13Select Done Editing and Save the workbook by selecting the Save icon
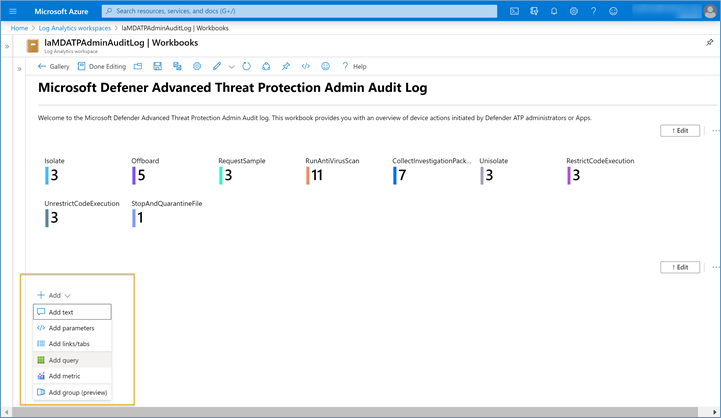
 And there we go, we know have our Microsoft Defender ATP Admin Audit log
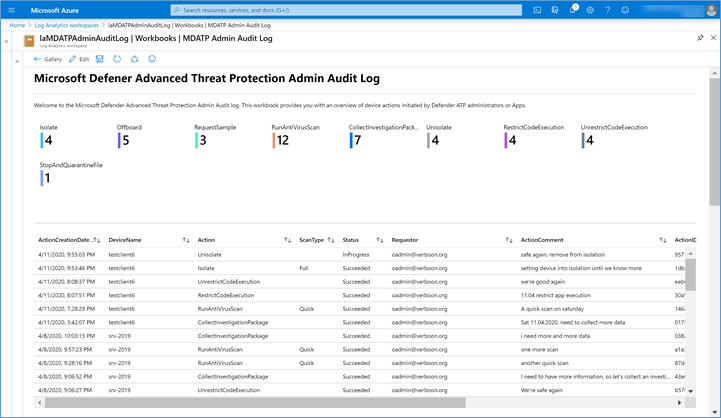
There is still room for improvements here. For example, right now we retrieve the complete machine actions history and store the results into log analytics, this means that we have many duplicate records, this isn’t an issue per se, because with the queries we use, we are removing these duplicates, nevertheless I am thinking of adding an OData filter to the query that limits the # of record to only the past n days. I am also thinking of adding parameters to the workbook that allows you to select a specific device and then get a list of all actions triggered for that device.
But this is it for today, I hope you enjoyed this blog post. As always, comments, feedback or suggestions are welcome.
Alex